


In March 2024, global trade data tracked by Datamyne shows that U.S. container imports saw a modest increase of 0.4% from February but surged by 15.7% compared to the same period last year, despite the Chinese Lunar New Year’s influence on late March figures. Notably, container imports from China continued to decline relative to February 2024, evident in significant volume drops at the Port of Los Angeles for the second consecutive month.
Key Takeaways from March 2024
- U.S. imports increased 0.4% compared to February, but gained 15.7% from the same period last year, despite the influence of the Chinese Lunar New Year.
- Container imports from China continued to decline in March relative to February, with a notable volume decrease at the Port of Los Angeles.
- Port transit delays showed overall improvement.
- Despite ongoing Panama Canal constraints, trade lanes remained unaffected by the Panama drought and Middle East conflict.
- The collapse of the Francis Scott Key Bridge on March 26 is disrupting trade flow at the Port of Baltimore, posing significant implications for trade routes and the broader economy.
- South Atlantic and Gulf Coast ports face potential labor disruptions later in the year due to the expiration of the ILA-USMX agreement, with the possibility of a coast-wide strike in October.
Port transit delays are improving, seemingly unaffected by predicted disruptions such as the Panama drought and Middle East tensions. Descartes’ April logistics metrics update reflects a strong start to the first quarter of 2024 for U.S. imports. However, concerns persist regarding global supply chain performance, with ongoing issues at the Panama and Suez Canals, upcoming labor negotiations at U.S. South Atlantic and Gulf Coast ports, Middle East conflicts, and the aftermath of the Francis Scott Key Bridge collapse, yet to fully manifest in U.S. container import data.
U.S. container imports demonstrate resilience in year-over-year comparisons. March 2024 volumes remained relatively stable compared to February, increasing by 0.4% to 2,145,341 twenty-foot equivalent units (TEUs) (see Figure 1). However, compared to March 2023, TEU volume rose by 15.7%, which also showcase a robust 20.6% increase from pre-pandemic March 2019 levels. The impact of the Chinese Lunar New Year, occurring on February 11 with an extended week-long holiday, delayed its influence on U.S. imports until the latter half of March 2024. To provide a more accurate comparison, Descartes analyzed global trade data for the first 15 days of March 2024 against the same period in 2023, revealing a substantial 22.7% growth in U.S. container imports.
Figure 1: U.S. Container Import Volume Year-over-Year Comparison

Source: Descartes Datamyne™
In March, Port Delays Show Progress.
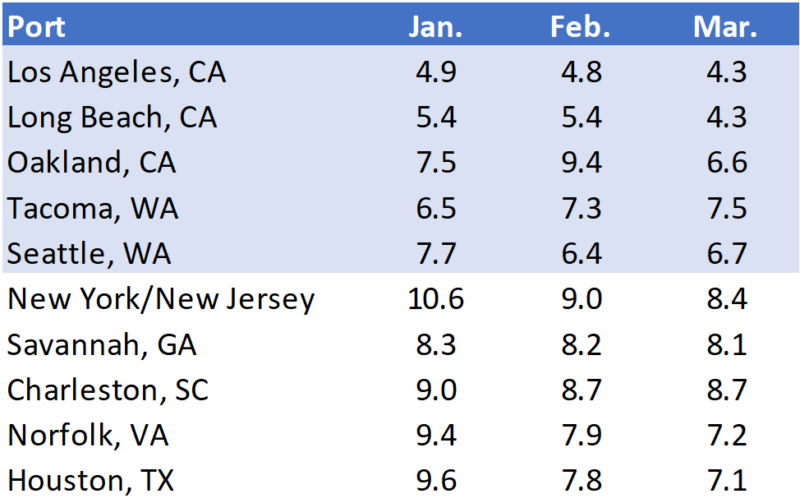
Transit delays at major ports in March 2024 continued to improve, according to Datamyne global trade data, with notable decreases recorded across most top ports (refer to Figure 2). However, Tacoma and Seattle experienced slight increases in delay averages compared to February. Notably, the Port of Oakland witnessed the most significant decline in delays, reducing by 2.8 days, followed by Long Beach with a decrease of 1.1 days.
Figure 2: Monthly Average Transit Delays (in days) at the Top 10 Ports
Source: Descartes Datamyne™
Note: Descartes’ definition of port transit delay is the difference as measured in days between the Estimated Arrival Date, which is initially declared on the bill of lading, and the date when Descartes receives the CBP-processed bill of lading.
Francis Scott Key Bridge Collapse Disrupts U.S. Imports via the Port of Baltimore.
The collapse of a crucial bridge at the Port of Baltimore on March 26 has severely disrupted trade flow. As the 10th largest port in the U.S. in 2023, this incident holds significant implications for trade routes, imports, exports, and the wider economy. With Baltimore representing 2.1% of U.S. container import volume and ranking tenth among ports by volume in 2023, the event poses a threat to this vital trade artery, impacting not only Baltimore but also the interconnected network of ports and transportation routes along the East Coast.
Managing Supply Chain Risks with Global Shipping Data
Trade data from March 2024 shows that U.S. container import volumes were mostly unchanged compared to February 2024. Overall port transit times in March improved compared to February delays. The collapse of the Francis Scott Key Bridge at the Port of Baltimore is stressing East Coast trade lanes and supply chains. Ongoing issues in Panama and the Middle East are creating pressure on global supply chains that could cause disruptions throughout 2024. Descartes will continue to highlight key Descartes Datamyne, U.S. government and industry data in the coming months to provide insight into global shipping.
To mitigate risks related to the current state of the global supply chain, shippers and logistics providers have strategies they can deploy, including using global trade and shipping data to mitigate supply chain risk with the key objective of keeping their international business healthy and growing, and maintaining a satisfied customer base. These strategies include:
1. Short-term: Monitor the Port of Baltimore’s post-Francis Scott Key Bridge collapse impact on East Coast container imports. Track the Panama Canal’s drought impact on shipping capacity and routes. Monitor Middle East conflicts for shipping diversions. Assess COVID variant spread for supply chain disruptions. Evaluate ocean shipments for timeliness. Assess inflation and conflicts for logistics costs. Evaluate potential October 2024 ILA strike impact on ports.
2. Long Term: Assess supplier and factory location concentration to reduce dependence on overstretched trade routes and conflict-prone regions worldwide. While density offers economies of scale, it also increases risk, as evidenced by the pandemic and ensuing logistics capacity challenges. Given that conflicts don’t arise suddenly, it’s crucial to address this potentially disruptive issue proactively.
The aim is to implement strategies to address both present and upcoming challenges. Through continuous assessment of potential trade lane disruptions and careful evaluation of geopolitical landscapes, businesses can maintain operational stability. In the long run, analyzing supplier distribution helps reduce dependence on fragile routes, fostering resilience amidst changing global conditions. Top of Form
How Datamyne Global Shipping Data Can Help Manage Supply Chain Risks
Descartes Datamyne delivers global trade and shipping data with comprehensive, accurate, up to date, import information that helps U.S. importers save significant time in spotting supply and demand shifts, optimizing trade lanes, expanding into new markets and identifying new buyers and suppliers.
Datamyne features the world’s largest searchable global trade database covering 230 markets across five continents. Gathered directly from official filings with customs agencies and trade ministries, including bills of lading, our data is detailed (down to company names and contact details), timely and authoritative.
Apart from providing trade intelligence via global trade and shipping data, Descartes software solutions also include a landed cost tool to calculate the economic viability of importing from a range of markets. Our applications can also screen against multiple denied parties lists simultaneously to help ensure organizations are not doing business with entities named on official government watch lists.
This is an excerpt of an article originally posted in the Descartes Global Shipping Crisis Resource Center. If you want to learn more about how Datamyne’s global trade and shipping data can help you, Contact Us
Note: This report uses the initial compiled release of U.S. Customs and Border Protection (CBP) data and is subject to revision later by CBP. The revised data can be seen in Descartes Datamyne.