Market watchers trying to factor in Iran’s potential return to global markets in oil, gas and petrochemicals have no choice but to spin many an alternative scenario.
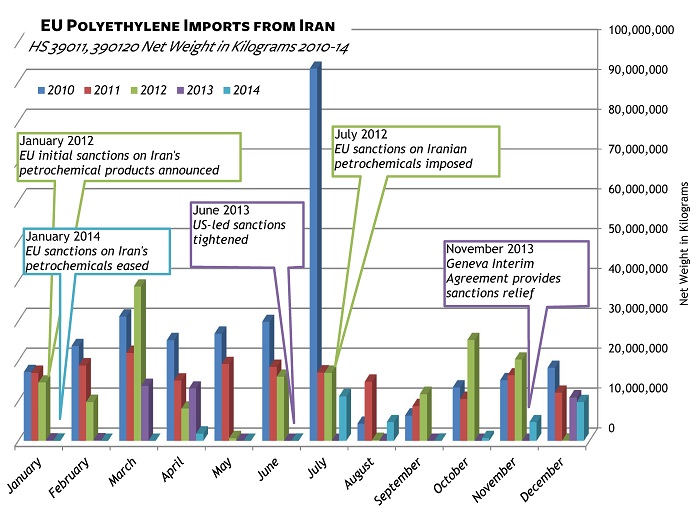
Limited sanction relief provided by November 2013’s Geneva Interim Agreement has resulted in limited increases in Iranian exports. But Iran would need time (three to four years according to this report from Energy Global) to ramp up to presanction production and export levels … if and when sanctions are fully lifted.
So, expect Iran to step off the sidelines and back into petrochemicals markets in fits and starts – as it has in the EU market for polyethylene (PE). Our data shows the uneven and delayed effects of sanctions tightening and easing on EU PE imports. Note that sanctions-related logistics and insurance constraints are also in play. Nonetheless, following the Geneva agreement sanctions relief, EU PE imports did record increases each month starting in June and continuing (just barely in September with 11,000 kilograms) through second-half 2014.
We’ll revisit the data on EU polyethylene trade later this year.
Related:
- Back in January, we wrote about the downward trend in US PE net exports – a trend likely to continue as top market countries such as Mexico, China and Brazil build out domestic PE production. Iran was mentioned as the chief source for China’s PE imports, having overtaken the US in 2010 and climbed to the top in 2012. [See the chart.]
- In Risky for Business, Peter Quinter writes about how sanctions can abruptly put a company on the wrong side of the law.


