


Trade data based on bills of lading shows 2023 U.S. imports declined at most of the busiest U.S. ports of entry.
After the sharp fall and rise of U.S. imports during and after the pandemic, the flow of 2023 U.S. inbound shipments settled into a pattern that looked a lot like that of pre-COVID 2019, according to the latest edition of the Descartes Datamyne Annual Port Report on the 30 top U.S. ports of entry.
Measured in TEUs (20-foot equivalent units) the volume of containerized shipments in 2023 was 4.4% higher than in 2019, but almost -11% lower than in 2022, a year of surging U.S. imports lifted by exuberant restocking following pandemic disruptions. Twenty-two of the country’s leading 30 ports posted year-over-year declines in inbound shipments last year.
Figure 1 Month-by-month Shipments of U.S. Imports in 2023 Return to Peak Shipping Pattern Last Seen in 2019
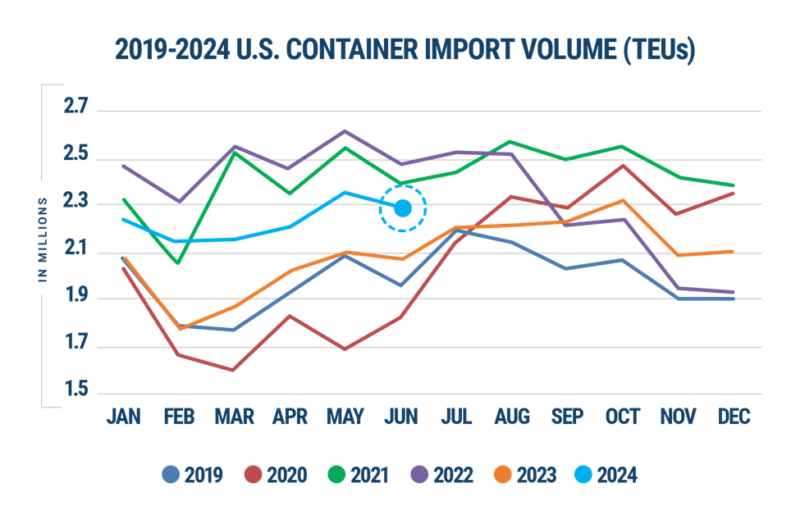
SOURCE: DESCARTES DATAMYNE ANNUAL PORT REPORT 2024
The Annual Port Report is based on data that is gathered directly from the bills of lading that document all shipments of U.S. imports, and is verified, standardized, and enhanced by Descartes Datamyne, provider of the world’s largest searchable trade database covering the global commerce of 230 markets across 5 continents.
The annual ranking of the top 30 U.S. ports of entry by volume of U.S. imports compares each port’s year end tally of inbound shipment TEUs and their calculated value with those of the previous year. A brief profile of each port covers year-over-year comparison of monthly TEUs, and lists top carriers, top consignees, and top countries of origin.
Among the key takeaways from the latest Port Report:
- U.S. imports that arrive from China by sea declined -13% overall in 2023, while China’s share of this trade ticked down from 38.1% to 37.2%.
- Ports reliant on merchandise trade generally felt the downturn more intensely than ports with a higher share of agricultural products in their mix of U.S. imports.
- The 2023 downturn in orders for the top-volume U.S. imports was nearly universal: Inbound TEUs in the broad product category (denoted by a 2-digit Harmonized System tariff code) of furniture [HS94] declined -19% year-over-year; machinery [HS84] imports, -3.9%; plastics [HS39], -11.1%; and so on through top 20, which account for about 78% of waterborne U.S. imports.
- Los Angeles remained the volume leader in U.S. imports in 2023. After moving up from No. 3 to 2 in 2022, the Port of New York-New Jersey remained the second busiest port in 2023, but its 15.1% lead over third-ranked Long Beach’s volumes narrowed to 5.9%.
A standard reference on maritime trade trends in U.S. imports for port authorities, carriers, logistics providers, importers, and shippers, the Descartes Datamyne Annual Port Report is available for free download with registration. Read the Descartes Datamyne Annual Port Report.
How Descartes Datamyne Can Help
Has highlighted in this Annual Report, Descartes Datamyne’s comprehensive trade data analysis is an invaluable resource for businesses navigating the complexities of U.S. imports. By leveraging detailed insights from bills of lading, companies can better understand shifts in trade patterns, identify key market trends, and make informed strategic decisions. Whether it’s adjusting supply chains, optimizing logistics, or anticipating market demands, Descartes Datamyne equips port authorities, carriers, logistics providers, importers, and shippers with the knowledge to enhance operational efficiency and competitiveness in a fluctuating global market.