U.S. Section 232 tariffs, broadly imposed on steel and aluminum imports in 2018, were a central trade strategy of the first Trump Administration. Descartes Datamyne trade data provides an indication of what the tariffs, deployed to protect U.S. industry against the impacts of global excess capacity can – and cannot – achieve.
How do you compete in a game where not everyone is playing by the same rules? How can market economies compete with non-market economies in international trade. That’s the question trading nations are struggling to answer as excess production capacity churns out far more supply than needed to meet global demand.
In this Article
Non-Market Factors Driving Global Excess Steel Capacity
The Organization of Economic Co-operation and Development (OECD) Global Forum on Steel Excess Capacity (GFSEC) convened recently to study causes, effects and remedies for excess steel capacity.
The Forum reviewed research findings that show most of the world’s excess steel capacity has been driven by non-market factors: “Indeed, the opening and closure of steel plants in GFSEC economies is typically based on the commercial decisions of private companies. However, in some other economies government interventions that stimulate investments in new plants, with capacities that often exceed underlying market demand for steel, or which keep inefficient plants in the market that would otherwise exit, are non-market factors that drive excess capacity.”
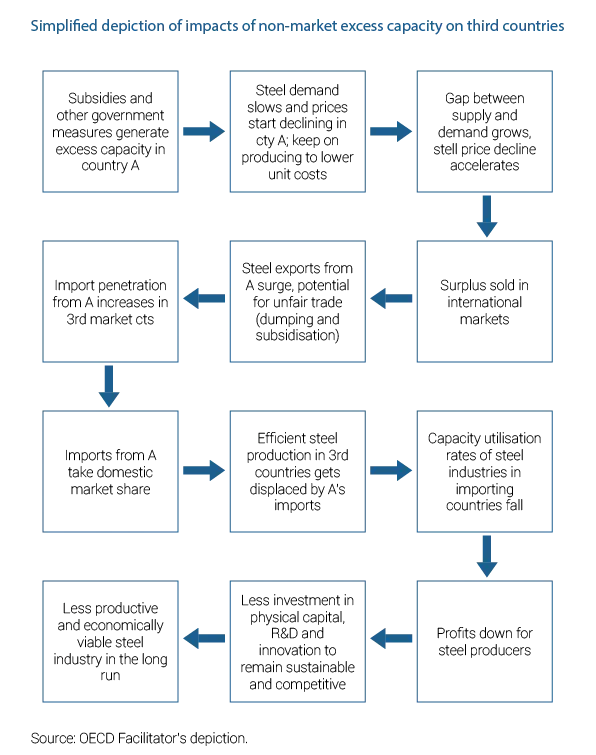
The result, according to GFSEC, is a ripple effect that undermines the profitability, innovation, and sustainability of steel producers everywhere, as this schematic summarizes:
Figure 1 View of the Impact of Non-market-drive Excess Capacity
Source: Global Forum on Steel Excess Capacity: Impacts of global excess capacity on the health of GFSEC steel industries
The challenge of global excess capacity is not limited to steel. As this report from Rhodium Group researchers documents, sectors including non-ferrous metals, textiles, pharmaceuticals, and the products of clean energy and information technologies are feeling the impacts of excess capacity – driven principally by China’s reliance on supply-side strategies and export markets to fuel its faltering economic growth.
In response, many OECD countries are weighing a combination of government subsidies to bolster domestic industries and higher tariffs to protect them against an onslaught of competing (often lower-cost) products from abroad.
Launched in the first Trump administration and extended through the Biden administration, Section 232 tariffs on steel and aluminum imports are a pioneering U.S. effort to deploy customs duties not merely as remedy for the direct injuries caused by unfair trade practices, but in the interest of national security.
Beyond Anti-Dumping and Countervailing Duties Remedies
The U.S. has relied on anti-dumping and countervailing duties (AD-CVD) to “level the playing field” when unfair trade practices tilt market competition for its domestic producers. Safeguard tariffs (so-called Section 201 tariffs) can be applied against sudden surges in imports to give U.S. companies a chance to play catch-up.
Anti-dumping duties, aimed at imports priced below market value, have been most often applied by the U.S., according to this Congressional Research Service report. But the use of CVDs, designed to counter the advantage of exporting country subsidies and first applied to Greek carbon steel pipe in 1986, has been on the upswing in recent years. Since the turn of the century, steel imports have been a particular focus of AD-CVD tariffs, imposed by the Bush and Obama administrations.
The U.S. tried a different approach in 2018. Section 232 of the Trade Expansion Act of 1962 authorizes the president to adjust imports that threaten national security by undermining vital domestic industries. The Trump administration invoked this little-used authority to impose tariffs on aluminum and steel imports from all exporters – 10% ad valorem tariff for aluminum and a 25% duty on steel – effective June 1, 2018. A measure of the tariffs’ effectiveness would be domestic manufacturers of these products operating at 80% capacity utilization.
Since then, the tariffs have been extended and modified. Prior to the effective date, the U.S. exempted North American trade partners Canada and Mexico from the tariffs, and temporarily suspended the tariffs while it negotiated quotas with Australia, Argentina, Brazil, South Korea, and EU member nations. Derivative products were subsequently added. Protections from Section 232 penalties were part of the US-Mexico-Canada Agreement (USMCA) that replaced NAFTA in 2020.
Canada, Mexico Major Trading Partners in Section 232 Steel
The Descartes Datamyne global trade data appears to show Canada and Mexico gaining share of U.S. steel imports in the years since Section 232 tariffs were implemented, as this snapshot illustrates:
Figure 2 Top Countries of Origin for U.S. Steel Subject to Section 232 Tariffs 2017 versus 2024

Source: Descartes Datamyne U.S. Census Import Data
The gain is not surprising given the USMCA partners’ tariff-free advantage. [Note: Canada’s and Mexico’s initial exemptions were paused June 1, 2018, and reinstated May 20, 2019.] What’s not clear in this view is that Mexico’s 11% share in the first three quarters of 2024, is a decline from its 15% share in 2020-2021. The lost ground (see Figure 2) may be largely due to the Biden administration’s requirements, instituted in July 2024, that steel imports from Mexico must be documented to have been melted and poured within the North American trade bloc to qualify for duty-free treatment. The objective is to keep exporters from evading the tariffs by transshipping their products through a backdoor.
Figure 3 U.S. Steel Imports from Mexico Falter in 2024

Source: Descartes Datamyne U.S. Census Import Data
The Biden administration also expressed concerns that exporters in countries subject to U.S. tariffs might shift production to Mexico, as the Mexico News Daily reports. Certainly, U.S. tariffs have spurred investment in shifting production to Southeast Asia, not only by Chinese state-owned and private enterprises, but by U.S. trading partners seeking to “de-risk” from over-dependence on Chinese manufacturing. As the New York Times reports, U.S. tariffs have transformed Vietnam into a global production hub. Vietnam, ranked 8th by value of trade as a source for U.S. steel imports in 2024 (Figure2), broke briefly into the top 10 in 2018, and was No. 9 in 2022 and 2023.
10-Year Trends in Imports of Section 232 Steel
Descartes Datamyne year-by-year data tracks how U.S. Section 232 tariffs, as well as other market-disrupters, shaped trade trends. Following are two views of the ups and downs of U.S. trade relationships with its top countries of origin for Section 232 steel imports over the last decade.
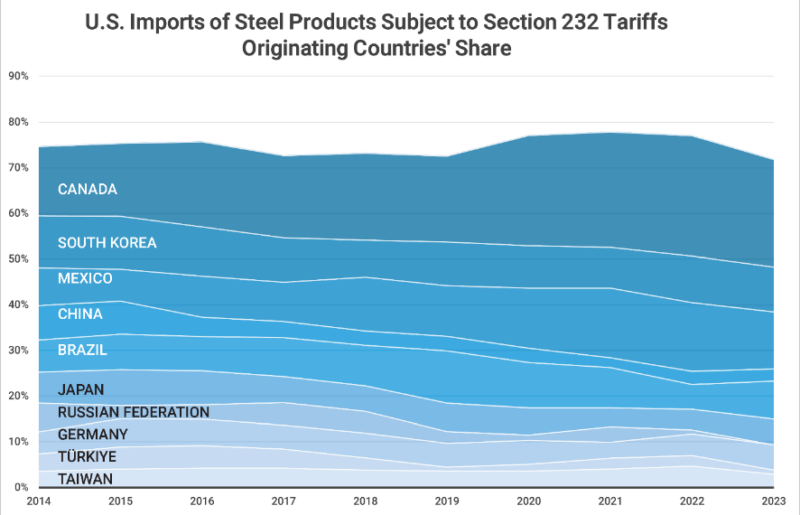
Start with data on imports from these Countries of Origin (COOs) ranked by share of trade:
Figure 4 Top Countries of Origin by Share of U.S. Steel Imports Subject to Section 232 Tariffs 2014-2023
Source: Descartes Datamyne U.S. Census Import Data
As the chart indicates, the shares claimed by Canada and, especially, Mexico got a boost in 2018, the year Section 232 tariffs took effect. South Korea ceded the No. 2 position to Mexico in 2018, and the No. 3 spot to Brazil in 2019.
China’s share was well in decline prior 2018. The U.S. implemented AD-CVDs on a range of steel products from a number of countries in 2015-16. Some of the stiffest penalties were imposed on corrosion-resistant (CORE) steel from China. The Chinese imports plummeted 96%; at the same time imports from Vietnam surged 5000%, as Descartes Datamyne data showed. “It can be like whack-a-mole,” one U.S. steelmaker exec said at time. “There is so much excess steel capacity in the world that when, say, [product from] China is blocked, here comes the steel from someplace else. Countries are watching for any market openings.”
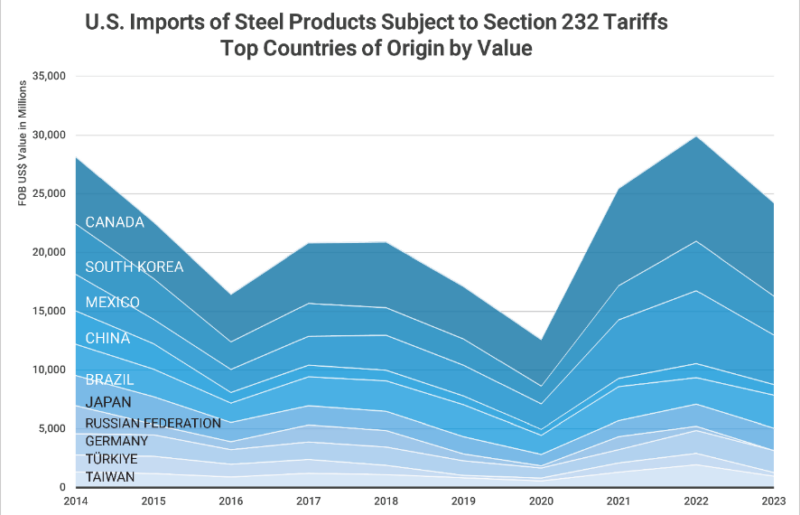
Of course, forces other than escalating tariffs were reshaping global markets over the decade. For instance, Canada’s leading share of 25% in 2020-21 was a slice of a much smaller pie, as the next chart illustrates:
Figure 5 Top Countries of Origin by Value of U.S. Steel Imports Subject to Section 232 Tariffs 2014-2023
Source: Descartes Datamyne U.S. Census Import Data
Imports of steel plummeted during the pandemic era. The value of Section 232 steel imports dropped -31%, the data shows.
Geopolitics were also in play – most visibly in the decline of Russian imports. In response to the Russia-Ukraine conflict, the U.S. suspended normal trade relations with Russian and Belarus in April 2022, clearing the way to raise tariffs on a range of products, including steel, to 35%. In June 2022, the U.S. suspended the Section 232 tariffs on steel imported from Ukraine, and subsequently extended the suspension into 2025.
The next chart brings together the trends in the value and volume of Section 232 steel since 2014.
Figure 6 Tracking the Value and Quantity of U.S Section 232 Steel imports 2014-2023

Source: Descartes Datamyne U.S. Census Import Data
The data shows Section 232 steel import volumes declining 11% in 2018 compared with the preceding year and, remaining well below (-19% to -26%) the 2017 benchmark – not counting the sharp -44% drop in pandemic year 2020.
Somewhat surprisingly, the data shows the value rising sharply against volume, an indication of rising steel prices in the years following the pandemic. The GFSEC counts this as an effect of the pandemic recovery: “This was a time when consumers during the pandemic increased their demand for goods including white goods, automobiles, bicycles, food cans, disinfectant aerosol cans, and other items that required steel. This contributed to the price of flat steel products more than doubling between June 2020 and August 2021.” Steel prices have softened in 2024, mostly due to China’s slowing construction sector and its excess steel production, according to (among others) the World Bank.
Top Trading Partners in Section 232 Aluminum
USMCA partner Canada has made significant gains in supplying the U.S. with aluminum since Section 232 tariffs became effective, moving from a commanding lead in benchmark year 2017 to a just more than half of these imports in the first three quarters of 2024, as this chart shows:
Figure 7 Top Countries of Origin for U.S. Aluminum Subject to Section 232 Tariffs 2017 versus 2024

Source: Descartes Datamyne U.S. Census Import Data
Mexico broke into the top 10 in this trade in the post-pandemic years. Its 2% share in 2024 is fractionally smaller than in 2023. As with Mexican steel imports, North American melt and pour requirements were applied to aluminum in July 2024. The U.S. also imposed a Section 232 tariff of 10% on aluminum imports from Mexico if the country of primary smelt, secondary smelt, or most recent cast is Belarus, China, Iran; a tariff of 200% applies to these imports from Russia.
10-Year Trends in Imports of Section 232 Aluminum
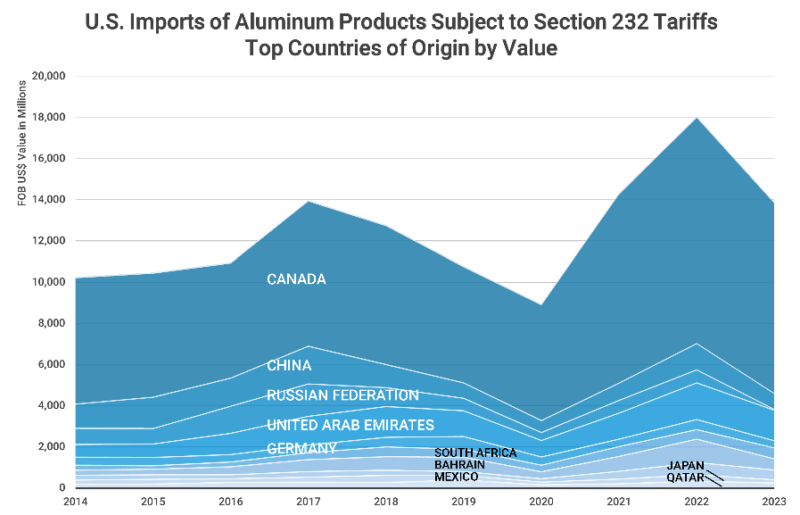
The U.S. boosted the Section 232 tariff rate on Russian aluminum to 200% in 2023: in March the punitive rate was imposed on aluminum and aluminum products from Russia; in April, the 200% duty was extended to any aluminum articles in which any amount of primary aluminum used in the manufacture of those articles was smelted in Russia, or the articles are cast in Russia.
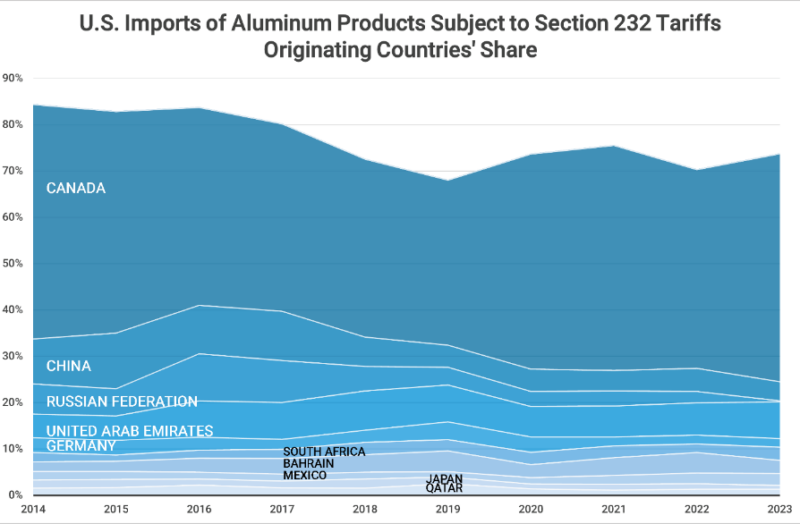
The result was an end to the flow of aluminum imports to the U.S. from the country that had been the third-ranked source prior to Section 232 tariffs, as the next charts illustrate:
Figure 8 Top Countries of Origin by Share of U.S. Aluminum Imports Subject to Section 232 Tariffs 2014-2023
Source: Descartes Datamyne U.S. Census Import Data
Figure 9 Top Countries of Origin by Value of U.S. Aluminum Imports Subject to Section 232 Tariffs 2014-2023
Source: Descartes Datamyne U.S. Census Import Data
The United Arab Emirates (UAE) ascended to second-ranked source for aluminum in 2018, with a 9% share of this trade by value (behind Canada’s 38%). The Section 232 tariff was partially waived and a quota on imports set for UAE aluminum in 2018. These modifications were revoked in 2021.
Here’s a view of the trade data tracking both the value and volume of the decade’s aluminum imports:
Figure 10 Tracking the Value and Quantity of U.S Section 232 Aluminum imports 2014-2023

Source: Descartes Datamyne U.S. Census Import Data
After 33% year-over-year growth in benchmark year 2017, the value of U.S. aluminum imports flattened to 1% in 2018, then fell -10% in 2019, and -23% in pandemic year 2020. Volume climbed 17% in 2017, fell -13% in 2018, saw no change in 2019, then fell -15% in 2020. During the post-pandemic years, aluminum imports increased 56% in value in 2021 and 35% in 2022, before falling -27%. Volume followed a similar pattern, rising 14% and 11%, then declining -13%. Per unit price has risen and fallen – but has remained higher than the 2017 benchmark of $2.49/kg. The per unit price of 2023’s imports was $3.24/kg.
Evaluating the Effects of Section 232 Tariffs
As the Descartes Datamyne trade data shows, the flow of imports subject to U.S. Section 232 tariffs has clearly shifted since 2018. COOs such as Canada, the UAE, and Vietnam have benefitted in exports sales and foreign investment. The U.S. reliance on China has decreased and trade with Russia completely disrupted.
What of the impact on the U.S. and its domestic industries?
The U.S. International Trade Commission’s (United States International Trade Commission) 2023 assessment of the economic impact of Section 232 tariffs, confirms that the volume of steel and aluminum imported by the U.S. was lowered and has since remained below pre-tariff levels. The share of steel consumption accounted for by imports trended downward through 2021. U.S. steel and aluminum exports have declined since 2017.
Many factors contribute to fluctuating prices in the global steel and aluminum markets. However, while prices are up worldwide, the increases for steel and aluminum have been much higher in the U.S. than elsewhere. These changes have had impacts on downstream industries such as construction, automotive manufacturing, and packaging.
Section 232 tariffs have had the desired effect in increasing the U.S. industries’ capacity utilization. The USITC reports steel capacity utilization ranged from 70% to 85% from 2018 to 2021. Aluminum capacity utilization ranged from 45% to 65%. However, the Section 232 tariffs are aimed at achieving utilization rates of 80% or higher, the level determined to be necessary to sustain adequate profitability, capital investment, R&D, and workforce employment. More recent figures from the American Iron and Steel Institute indicate raw steel capacity utilization at 75.7% in 2024 (through mid-December) down slightly from the 76% average rate over the same period in 2023. The Section 232 tariffs and quotas on steel and aluminum remain shy of their goal.
How Descartes Datamyne Can Help
Descartes Datamyne provides powerful trade data analytics that allow businesses to track the real-time impact of U.S. Section 232 tariffs on steel and aluminum imports. By leveraging this detailed data, companies can gain a deeper understanding of shifting trade dynamics, including changes in market share by country of origin, volume fluctuations, and the effects of tariffs on global supply chains.
Global trade insights from Descartes Datamyne reveal how countries like Canada, Mexico, and Vietnam have gained market share as a result of Section 232 tariff exemptions or adjustments. These insights are essential for businesses to navigate the complexities of international trade, anticipate market shifts, and make informed decisions about sourcing and pricing strategies. Whether you’re a manufacturer, exporter, or importer, Descartes’ comprehensive data helps you stay competitive in an evolving global market shaped by tariff policies.


